Market Screener
Shortlist instruments systematically
Compare supported instruments on technical metrics and pick candidates for a closer look on Chart or symbol pages.
Open screenerScreen supported crypto, stock-linked, ETF-linked, forex and commodity markets. Compare timeframes, study charts and build rule-based strategies with TAP. Add market news and observed public trader positions to your research.
Compare market conditions across four research timeframes and see where trend, momentum and breadth agree or diverge. Then open the matching market area for deeper analysis.
Market Status is a scheduled research snapshot (about every 5 minutes for crypto tools), not a tick-by-tick feed. Missing values stay missing — we do not invent substitutes.
Narrow the universe by trend, momentum, volatility and other technical criteria. Use the filter that fits how you want to shortlist candidates for deeper work.
Shortlist instruments systematically
Compare supported instruments on technical metrics and pick candidates for a closer look on Chart or symbol pages.
Open screenerCombine technical conditions
Link supported indicator conditions on one shared timeframe and find instruments that match your research approach.
Open indicator filterConnect several timeframes in one search
Assign different timeframes to supported conditions — for example trend on 4h, momentum on 1h and an extra check on 15m. Example only; not every indicator or market supports every combination.
Open smart filterOpen a scanner for the constellation you care about, then confirm structure on Chart. Scanner simulations and Chart TAP reviews can use different exit or cost assumptions.
Find supported candlestick patterns and review them with trend and market structure.
Open candlestick scannerInspect supported chart formations and open matching instruments for a closer check on Chart.
Open chart pattern scannerSearch RSI and OBV divergences and study differences between price and indicator behaviour. MACD or hidden divergences are not claimed here.
Open divergence scannerFind setups from the Strategy Library and compare available simulation results under the stated model assumptions — research rankings, not live account performance.
Open strategy library scannerReview current assessments, trend structure, momentum and conflicts between timeframes. Compare the latest view with saved analysis snapshots where available.
The four research timeframes 15m, 1h, 4h and 1d are shown separately — including 4h.
Evidence or agreement style scores describe how readings line up — not a win probability.
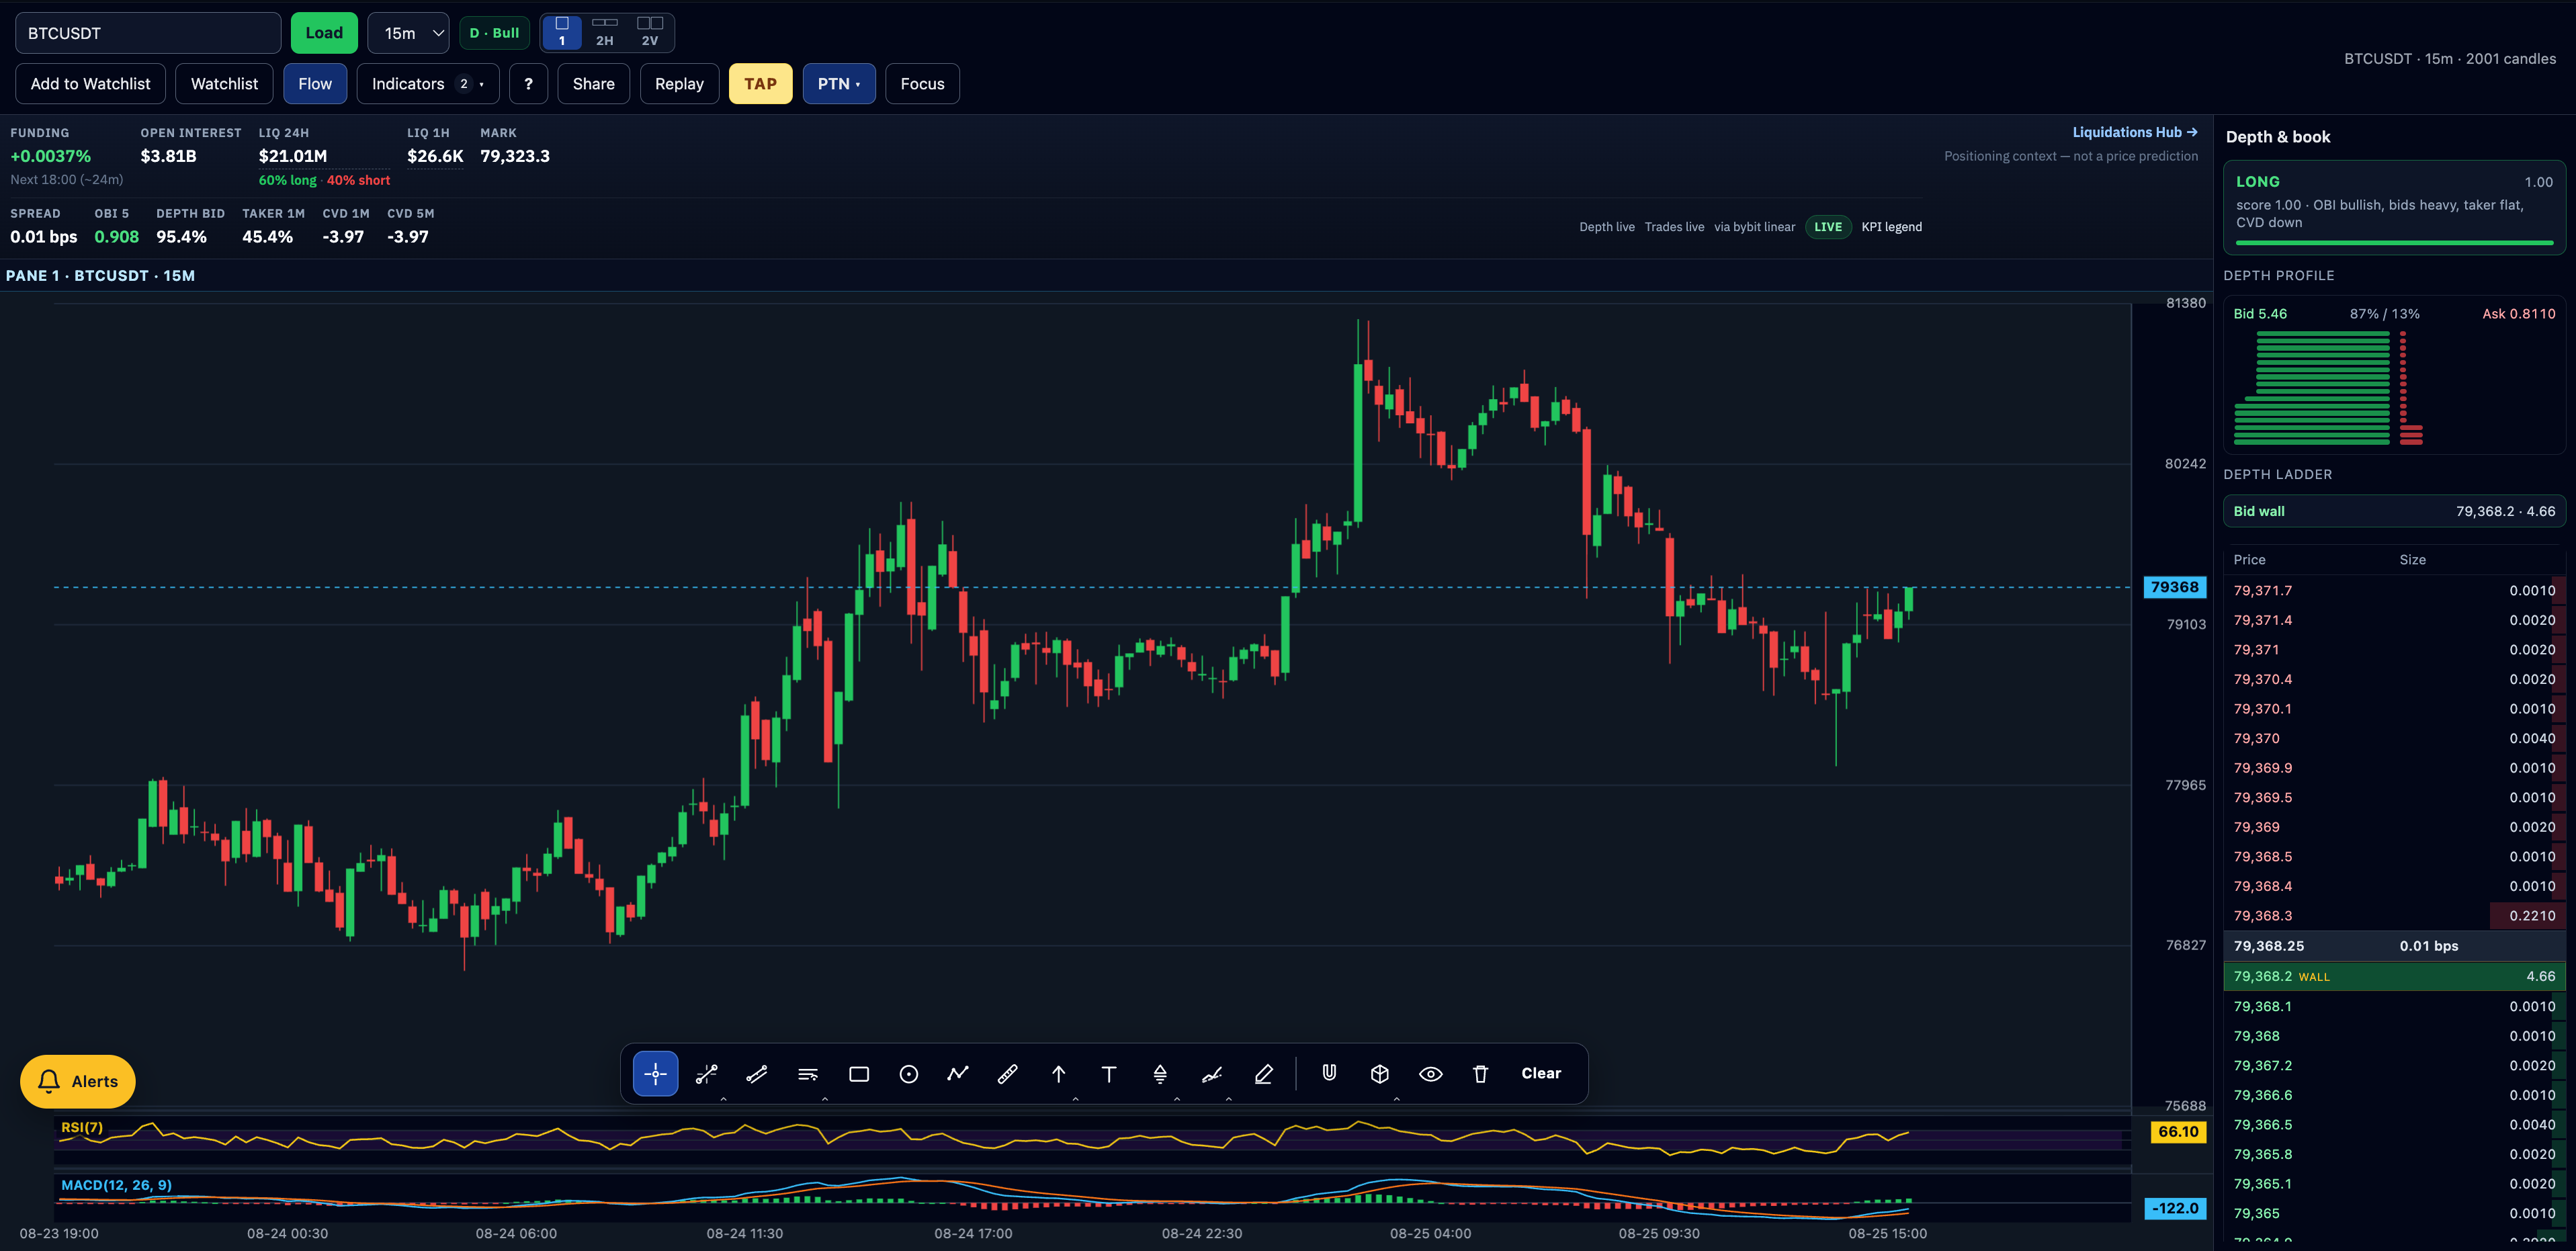
Analyse price action, technical indicators and available add-on data in an interactive workspace. Adjust the layout to your process and open instruments directly from supported tools.
Define long and short conditions, review simulated trades and explore risk settings on the candles currently loaded in Chart.
Combine supported indicators and conditions into a clear rule set.
Start from a Strategy Library template and adjust supported parameters.
Review supported stop-loss, take-profit, partial, trailing and break-even settings.
Look at available metrics such as simulated result, drawdown, hit rate and individual trades together with the data and assumptions used.
Compare behaviour on separate training and test windows and use supported walk-forward checks where available.
Save, share or reuse supported setups through the product features provided for that.
TAP studies rules on the loaded chart candles. Simulation metrics apply to that data scope only — not automatic order execution and not a claim that Stratum or Market Status feed TAP automatically.
TradeAnalyzer Live supports the chart and strategy workflow. “Live” does not mean automatic order routing or an arbitrarily deep historical backtest.
Review available data on trading activity, volume, order book and liquidations. Compare them with price structure and note each source’s coverage.
Depth, delta/CVD, volume profile and footprint where the instrument supports them.
Observed forced closures from supported venues — distinct from order-book heatmaps and from public account positions in Stratum.
Some views use aggregated or history-lite series. A full tick or L2 archive is not claimed.
Compare observed positions, changes between snapshots and public account profiles. Always weigh freshness, sample size and concentration.
Displayed data describe a sample of public venue data — not copy trading, not a full-market census and not an automatic TAP feed.
Read structured market digests on relevant developments, possible drivers and risks. Then continue in the matching market area or Chart. Digests use a 4-hour research horizon; publication timing can differ from that horizon.
Structured digests across crypto, forex, stock-linked and commodity themes — original research notes, not wire reprints or live trade signals.
Organise selected instruments on your watchlist and monitor supported price, indicator or TAP conditions.
Browser-based monitoring needs an active session. Do not assume always-on 24/7 delivery on every plan.
Scan a broad crypto universe with technical filters, multi-timeframe analysis and crypto-specific derivatives context where supported.
Research stock-linked markets and supported ETFs with technical screening, sector context, charts and TAP workflows — 130+ stock-linked · 24 ETFs (tokenized perpetuals, not share ownership).
Analyze 11 supported currency pairs across 15m, 1h, 4h and 1d using technical screeners, comparison tools and TAP workflows.
Study supported metals and energy markets with transparent instrument classification, multi-timeframe indicators and TradeAnalyzer chart workflows — 5 metals · 3 energy.
Stock-linked and ETF-linked markets are represented via USDT perpetual contracts. No shares or ETF units are purchased. Commodity markets are USDT perpetuals (metals & energy). Active gold: XAUUSDT under Commodities.
Check data sources, refresh times and calculation bases so you can place live charts, saved analyses and simulation results in context.
Short answers on markets, tools, data freshness and access — educational use only, not financial advice.
You can filter markets, study instruments, analyse charts, review rules with TAP (TradeAnalyzer Performance Engine) and monitor supported conditions. Market News and observed public positioning in Stratum Discover add further research context.
Crypto (650+ USDT markets), stock-linked markets (130+), 11 forex pairs and commodities (8; metals & energy). Gold perpetual is XAUUSDT — XAUUSD is separate. Supported timeframes: 15m, 1h, 4h, 1d.
The Market Screener shortlists instruments on technical metrics. The Indicator Filter combines conditions on one shared timeframe. The Smart Indicator Filter can assign different timeframes to supported conditions — only where those combinations exist.
TAP — TradeAnalyzer Performance Engine — is rule-based strategy research without coding on the candles currently loaded in Chart. It is not trade execution and not a complete archived backtest. Details: Strategies.
No. Chart and some order-flow surfaces update continuously where connected. Screeners and Market Status follow scheduled research cycles (about every 5 minutes for many crypto tools). Saved analyses and TAP results reflect the data loaded at review time.
Stratum Discover shows observed public venue accounts and positions inside a limited sample. Freshness, sample size and concentration matter. It is not a full-market census and does not auto-feed TAP.
Watchlist & Alerts use the browser dock while this tab stays open. Optional browser notifications need your permission. Web Push and server-side TAP monitoring apply only when your plan and product flags enable them.
No. TradeAnalyzer.Pro is a research and analysis platform. It does not route or execute live orders from TAP, screeners or Stratum Discover.
Public research pages such as screeners, Market Status, symbol pages, Chart and Stratum Discover are available from the homepage links. Some liquidations, alert channels or cloud sync features may require sign-in or a plan — the product shows access rules where they apply.
The public site is available in English, German, French, Spanish, Portuguese (Brazil), Dutch, Turkish, Russian, Simplified Chinese, Japanese, Korean, Persian and Arabic (13 locales).
Choose a market, shortlist relevant instruments and explore them further on the chart.
TradeAnalyzer.Pro provides analytical and educational market information and does not provide financial advice.