Divergence Scanner Guide
RSI and OBV divergences for research
The divergence scanner helps you find RSI and OBV divergences between price and indicator behaviour. Use divergences as hypotheses to study on Chart — not as standalone entry signals. This surface documents RSI/OBV — do not assume MACD or hidden divergences are included.
Open Live Tool →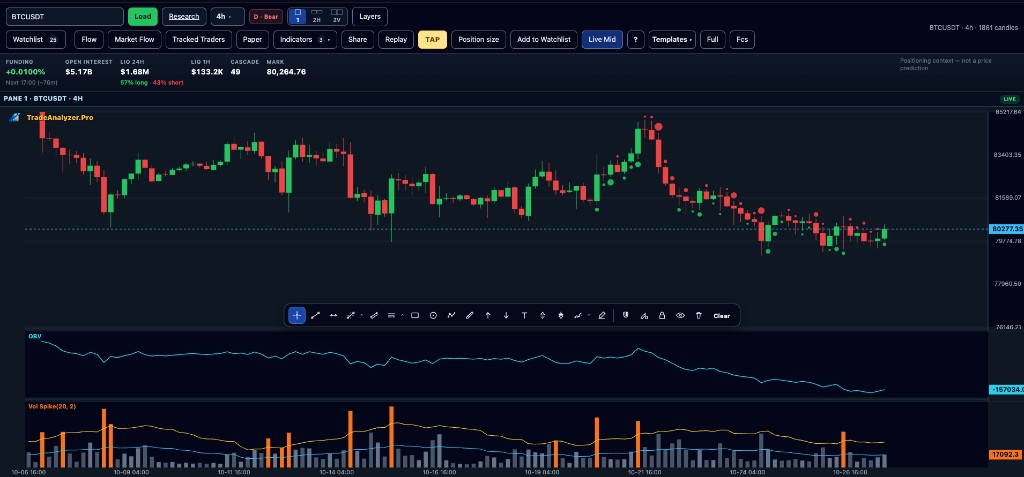
Key points
- Focus on RSI/OBV divergences as documented on the tool
- Hidden or MACD divergences are not claimed on this surface
- Confirm with structure and risk before acting
- Works best with multi-timeframe context
- Treat disagreement as a question, not a prediction
Why this matters
Divergences highlight tension between price and momentum/flow. They are useful alerts for deeper chart work — not automated reversal guarantees.
How to use this in your workflow
1. Scan for divergences
Open the divergence scanner and review matches.
2. Open Chart
Inspect whether price structure supports the divergence story.
3. Optional filters
Cross-check with screener or Smart Indicator Filter criteria.
4. Define invalidation
If you act later, know what price would negate the idea.
Common pitfalls
- Assuming every divergence reverses
- Claiming MACD/hidden coverage when the tool lists RSI/OBV
- Skipping higher-timeframe structure
Live tools on TradeAnalyzer.Pro
Related education guides
Frequently asked questions
Which divergences are included?
The product documents RSI and OBV divergences for this scanner. Do not assume MACD or hidden divergences are covered here.
Are divergences predictive?
They are research cues about disagreement between price and indicators — not win probabilities.
Best companion tools?
Chart structure, RSI education guide, and optional Smart Indicator Filter.
Continue on the live platform
Apply what you learned with screeners, charts, TAP and multi-asset research on TradeAnalyzer.Pro.
Open Live Platform →