CCI Indicator Guide for Crypto, Forex & Gold Trading
Complete Tutorial: CCI Calculation, Momentum Oscillator, and Professional Trading Strategies
Learn how to use the Commodity Channel Index (CCI) indicator for trading crypto, major forex pairs and gold (XAUUSDT). This comprehensive guide covers CCI calculation, momentum expansions, overbought/oversold levels, and how to combine CCI with other technical indicators Several indicators can agree. Agreement does not prove a higher hit rate. The examples use crypto charts, but the same CCI logic applies across forex and gold on TradeAnalyzer.Pro.
Use CCI Tool →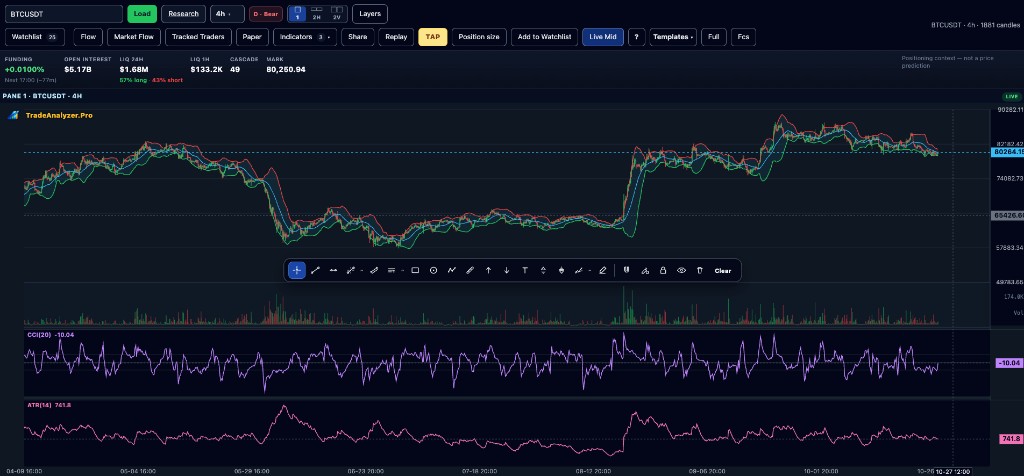
What is the CCI Indicator?
The Commodity Channel Index (CCI) is a momentum oscillator developed by Donald Lambert in 1980. Originally designed for commodity markets, CCI has proven extremely useful for cryptocurrency trading. The indicator measures how far price deviates from its statistical average to identify momentum expansions, pullbacks, and potential overbought/oversold conditions.
CCI values can theoretically range from -∞ to +∞, but in practice they typically move between -300 and +300. Values above +100 indicate strong upward momentum (potential buying opportunities on pullbacks), while values below -100 indicate strong downward momentum (potential selling opportunities on rallies). CCI values between -100 and +100 are considered neutral and indicate that price is near its average.
How is CCI Calculated?
CCI uses a default 20-period calculation, though traders can adjust this period based on their trading style and timeframe. The calculation compares the current price with its statistical average and normalizes the deviation.
CCI Formula
                        CCI = (Typical Price - SMA of Typical Price) / (0.015 × Mean Deviation)


                        Where:

                        Typical Price = (High + Low + Close) / 3


                        SMA of Typical Price = Sum of Typical Prices over N periods / N


                        Mean Deviation = Average of |Typical Price - SMA| over N periods


                        N = Period (typically 20)

                        0.015 = Normalization constant (70-80% of values fall between -100 and +100)
Step-by-Step Calculation Process
- Calculate Typical Price: For each period, calculate the Typical Price as (High + Low + Close) / 3.
- Calculate SMA of Typical Price: Sum all Typical Prices over the specified period (typically 20 periods) and divide by the number of periods.
- Calculate Mean Deviation: For each period, calculate the absolute deviation |Typical Price - SMA|, sum these deviations, and divide by the number of periods.
- Calculate CCI: Apply the formula CCI = (Typical Price - SMA) / (0.015 × Mean Deviation) to get the final CCI value.
CCI Momentum Oscillator: Signals and Interpretation
CCI functions as a momentum oscillator that measures the strength and direction of price movement. Understanding CCI signals helps traders identify potential entry and exit points in cryptocurrency markets.
CCI Above +100 (Strong Upward Momentum)
When CCI rises above +100, it indicates strong upward momentum. This can create potential trading opportunities:
- Momentum Expansion: CCI values above +100 show that price is significantly above its average and strong upward momentum is present.
- Pullback Entries: Professional traders use CCI above +100 to identify pullbacks in uptrends. When CCI remains above +100 and price pulls back, this can be a buying opportunity.
- Trend Confirmation: CCI above +100 in combination with an uptrend confirms trend strength and can be used for trend-following strategies.
CCI Below -100 (Strong Downward Momentum)
When CCI falls below -100, it indicates strong downward momentum. This can create potential trading opportunities:
- Momentum Expansion: CCI values below -100 show that price is significantly below its average and strong downward momentum is present.
- Rally Exits: Professional traders use CCI below -100 to identify rallies in downtrends. When CCI remains below -100 and price rises, this can be a selling opportunity.
- Trend Confirmation: CCI below -100 in combination with a downtrend confirms trend strength and can be used for trend-following strategies.
CCI Between -100 and +100 (Neutral)
When CCI is between -100 and +100, this is considered neutral. Price is near its average:
- Consolidation: CCI values in the neutral range indicate consolidation or sideways movement.
- Waiting for Signals: Professional traders often wait for CCI breakouts above +100 or below -100 before entering trades.
- Mean Reversion: In sideways markets, CCI values in the neutral range can signal mean-reversion opportunities.
CCI Divergence Patterns
CCI divergence occurs when price and CCI move in opposite directions, providing powerful signals for potential trend reversals in cryptocurrency markets.
Bearish Divergence (Bearish Signal)
Bearish divergence occurs when the cryptocurrency price makes a new high, but CCI fails to reach a new high or forms a lower high. This indicates weakening upward momentum and potential price reversal:
- Signal: Price reaches new high, CCI forms lower high
- Interpretation: Upward momentum is weakening despite higher prices
- Action: Consider taking profits on long positions or preparing for potential short opportunities
Bullish Divergence (Bullish Signal)
Bullish divergence occurs when the cryptocurrency price makes a new low, but CCI forms a higher low. This indicates weakening downward momentum and potential price reversal:
- Signal: Price reaches new low, CCI forms higher low
- Interpretation: Downward momentum is weakening despite lower prices
- Action: Consider potential buying opportunities or covering short positions
Using CCI with Other Technical Indicators
CCI is most effective when combined with other technical indicators. Professional traders use multiple indicators together. Several indicators can agree. Agreement does not prove a higher hit rate.
CCI + RSI (Relative Strength Index)
Combining CCI with RSI provides powerful momentum confirmation and helps identify overbought/oversold conditions:
- Momentum Confirmation: When CCI and RSI both indicate the same direction, it significantly strengthens the trading signal
- Overbought/Oversold: RSI shows overbought/oversold conditions, while CCI shows momentum strength
- Entry Timing: Use CCI threshold levels (+100/-100) with RSI overbought/oversold levels for optimal entry points
CCI + MACD (Moving Average Convergence Divergence)
MACD provides trend confirmation and helps identify momentum shifts:
- Trend Confirmation: When CCI and MACD both indicate the same direction, it strengthens the trading signal
- Momentum Shift: MACD crossovers can confirm CCI threshold signals
- Divergence Detection: MACD divergence can confirm CCI signals. When CCI shows divergence and MACD also shows it, this is a very strong signal
CCI + ADX (Average Directional Index)
ADX measures trend strength and is an excellent complement to CCI:
- Trend Strength: ADX above 25 indicates a strong trend, making CCI signals more reliable
- Range vs. Trend: When ADX is below 25 (weak trend), CCI threshold signals are more effective for mean-reversion strategies
- Strategy Selection: Use CCI threshold levels in trending markets (high ADX) and CCI mean-reversion in sideways markets (low ADX)
CCI + Moving Averages
Moving averages help identify trend direction, which is essential for CCI interpretation:
- Trend Context: Use moving averages to determine if you're in an uptrend or downtrend
- Signal Filtering: In uptrends, focus on CCI pullbacks above +100 (buying opportunities). In downtrends, focus on CCI rallies below -100 (selling opportunities)
- Multi-Timeframe: Use longer timeframe moving averages for trend direction and shorter timeframe CCI for entry timing
CCI + Volume Indicators
Volume confirmation is crucial for validating CCI signals:
- Volume Confirmation: CCI threshold signals are stronger when accompanied by high volume
- Divergence Validation: Volume patterns can confirm CCI divergence signals
- Breakout Confirmation: Use volume spikes to confirm CCI signals during market breakouts
Multi-Timeframe CCI Analysis
Professional traders use CCI across multiple timeframes. Several indicators can agree. Agreement does not prove a higher hit rate. Multi-timeframe analysis helps identify both short-term entry points and longer-term trend direction.
Timeframe Selection Strategy
- 15-Minute (15m): Use for short-term entry timing and scalping strategies. CCI signals on 15m timeframe provide quick entry/exit points.
- 1-Hour (1h): Ideal for intraday trading. 1h CCI provides balance between signal frequency and reliability.
- 4-Hours (4h): Excellent for swing trading. 4h CCI signals are more reliable and help identify medium-term trends.
- Daily (1d): Use for position trading and long-term trend analysis. Daily CCI helps identify major trend reversals.
Multi-Timeframe Confirmation
For stronger signals, confirm CCI readings across multiple timeframes:
- Trend Alignment: When longer timeframe (4h, 1d) CCI confirms the direction of shorter timeframe (15m, 1h) CCI, signals are stronger
- Entry Timing: Use longer timeframe for trend direction, shorter timeframe for entry timing
- Risk Management: Longer timeframe CCI helps set stop-loss levels, shorter timeframe CCI helps with entry precision
CCI Trading Strategies
Professional traders use various CCI-based strategies depending on market conditions and trading style. Here are the most effective CCI trading strategies for cryptocurrency markets:
Strategy 1: CCI Threshold Strategy (+100/-100)
This is the most basic CCI strategy, ideal for trending markets:
- Buy Signal: CCI rises above +100 (strong upward momentum), then pullback above +100
- Sell Signal: CCI falls below -100 (strong downward momentum), then rally below -100
- Best For: Trending markets with clear momentum expansions
- Risk: Can generate false signals in sideways markets
Strategy 2: CCI Divergence Trading
This strategy focuses on identifying trend reversals using CCI divergence:
- Bearish Divergence: Price makes new high, CCI makes lower high → Potential sell signal
- Bullish Divergence: Price makes new low, CCI makes higher low → Potential buy signal
- Best For: Identifying trend reversals in trending markets
- Confirmation: Always confirm with volume analysis and support/resistance levels
Strategy 3: CCI + Trend Following
Combine CCI with trend analysis for stronger signals:
- Uptrend Strategy: In uptrends, buy when CCI rises to +100 and stays above +100
- Downtrend Strategy: In downtrends, sell when CCI falls to -100 and stays below -100
- Best For: Trending markets where CCI can remain in extreme zones
- Advantage: Reduces false signals by aligning with trend direction
Strategy 4: CCI + Multiple Indicators
Combine CCI with RSI, MACD, and other indicators. Several indicators can agree. Agreement does not prove a higher hit rate.
- Multi-Indicator Confirmation: Wait for CCI, RSI, and MACD to all align before entering trades
- Signal Strength: Several indicators can agree. Agreement does not prove a higher hit rate
- Best For: Professional traders. Several indicators can agree. Agreement does not prove a higher hit rate
- Tool: Use indicator filter tools to scan for multi-indicator setups automatically
Strategy 5: CCI Mean-Reversion Strategy
This strategy uses CCI for mean-reversion in sideways markets:
- Buy Signal: CCI falls significantly below -100, then returns above -100
- Sell Signal: CCI rises significantly above +100, then returns below +100
- Best For: Sideways markets with clear support and resistance levels
- Risk: Can generate false signals in strong trending markets
Common CCI Trading Mistakes to Avoid
Understanding common CCI mistakes helps traders avoid costly errors and improve trading performance:
Practical Example: CCI Entry and Exit Strategy
Scenario: Bitcoin (BTC) is in an uptrend on the 4-hour chart. CCI on 1-hour chart rises above +100 (strong upward momentum), then pullback to +95, followed by a renewed rise above +100. Volume increases during the renewed rise.
Entry Signal: CCI rises again above +100 with volume confirmation. Entry price: $42,500. Stop-loss: $41,800 (below recent support).
Exit Strategy: Take profit when CCI falls below +100 or when price reaches resistance level. This example is illustrative: an entry and a stop are shown, and no target price is stated.
Key Lesson: Always combine CCI signals with trend direction, volume confirmation, and support/resistance levels for higher-probability trades.
Mistake 1: Using CCI Alone
CCI should never be used in isolation. Always combine CCI with other indicators, trend analysis, and market context for reliable signals.
Mistake 2: Ignoring Market Context
CCI signals have different meanings in trending vs. sideways markets. Always consider the overall market trend before acting on CCI signals.
Mistake 3: Not Using Multiple Timeframes
Single timeframe CCI analysis can miss important context. Always check CCI across multiple timeframes (15m, 1h, 4h, 1d) for confirmation.
Mistake 4: Reacting to Every Signal
Not every CCI signal is worth trading. Several indicators can confirm one another. That does not prove a higher hit rate.
Mistake 5: Ignoring CCI Divergence
CCI divergence patterns are powerful signals that many traders overlook. Learn to identify and use divergence patterns for better entry and exit timing.
Related Trading Tools and Resources
CCI works best when combined with other analysis tools. Here are related resources to enhance your CCI trading strategy:
Popular Symbol Analysis Pages
Open live multi-timeframe analysis for major crypto pairs on TradeAnalyzer.Pro — RSI, MACD, trend strength, divergences and signals in one place.
CCI Frequently Asked Questions (FAQ)
Answers to frequently asked questions about the CCI indicator and its use in cryptocurrency trading.
Start Using CCI for Cryptocurrency Trading
Access professional CCI analysis tools with real-time multi-timeframe data and comprehensive trading insights.